Beyond gathering, a template is shared basis of evaluations. All parameters, needed for reports, key-figures and Presentation are part of it. How subsets get evaluated and become comparable, is determined by the amount and structure of the content layers, being created.
Core all over key figures are averages, calculated from the maximum of points, divided by the point that got reached per assessment in consideration of inapplicable questions.
Retrievable at any time: auditBus statistics and evaluations
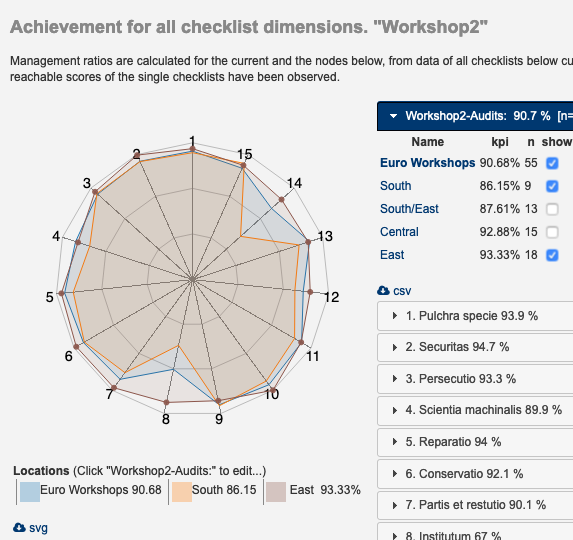
Retrieve intermediate results, including current key figures, amounts and current state of assessments and benchmarks including the completed assessments per template, dynamically calculated by selecting any of the evaluation functions.

Identify problem areas
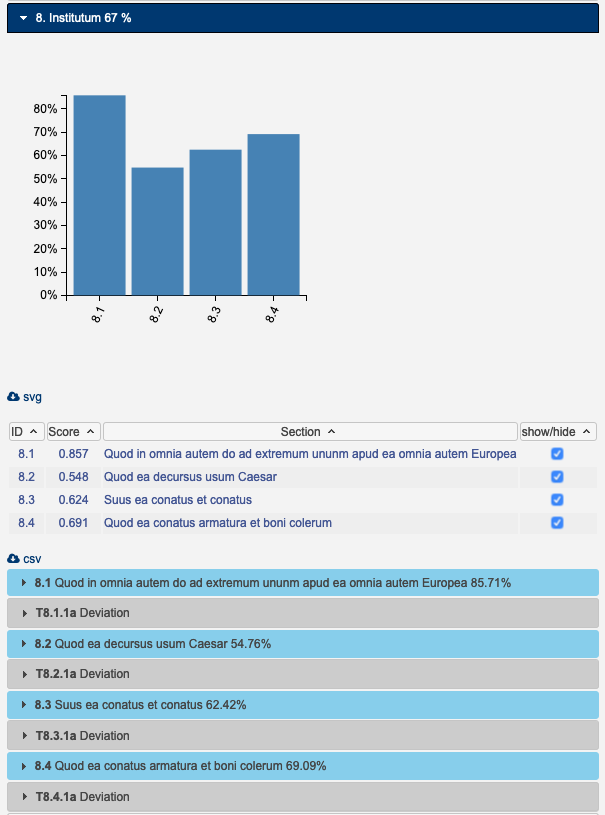
Just pick one specific section to dive into detailed analysis of the selected assessment. Key figures show attainments for each tested standard regarding the currently selected content layer. Barcharts facilitate identification of insufficient results at first sight.
All Charts and Tables can easily be downloaded as .svg or .csv data.

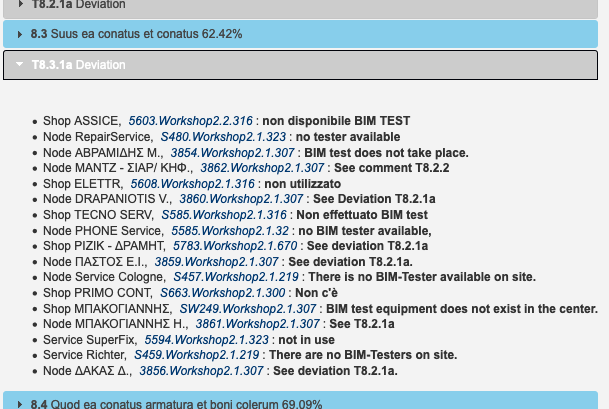
If your template supports mandatory deviation capturing, you will be able to analyse causes of each single task and follow implementations. Deviations are directly linked to related assessments.

Download charts and tables for individual purposes
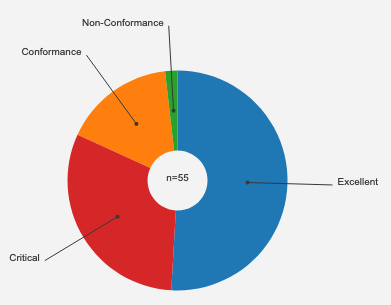
Possibility to download single charts might be useful to enrich individual presentations. Beyond radar and bar charts visualising key figures, auditBus provides statistical counting of all options per question, accepting results of completed audits of the selected content layer.

